Sports-related injuries
Injuries in this section include those noted as occurring during specific sports (e.g., hockey, baseball), during other recreational physical activities (e.g., cycling, swimming and diving in a pool or natural water, skiing/snowboarding, recreational boating, ATV/snowmobiling), through the use of sporting equipment (e.g., “hit by ball,” “fall involving skateboard”), and falls from playground equipment.
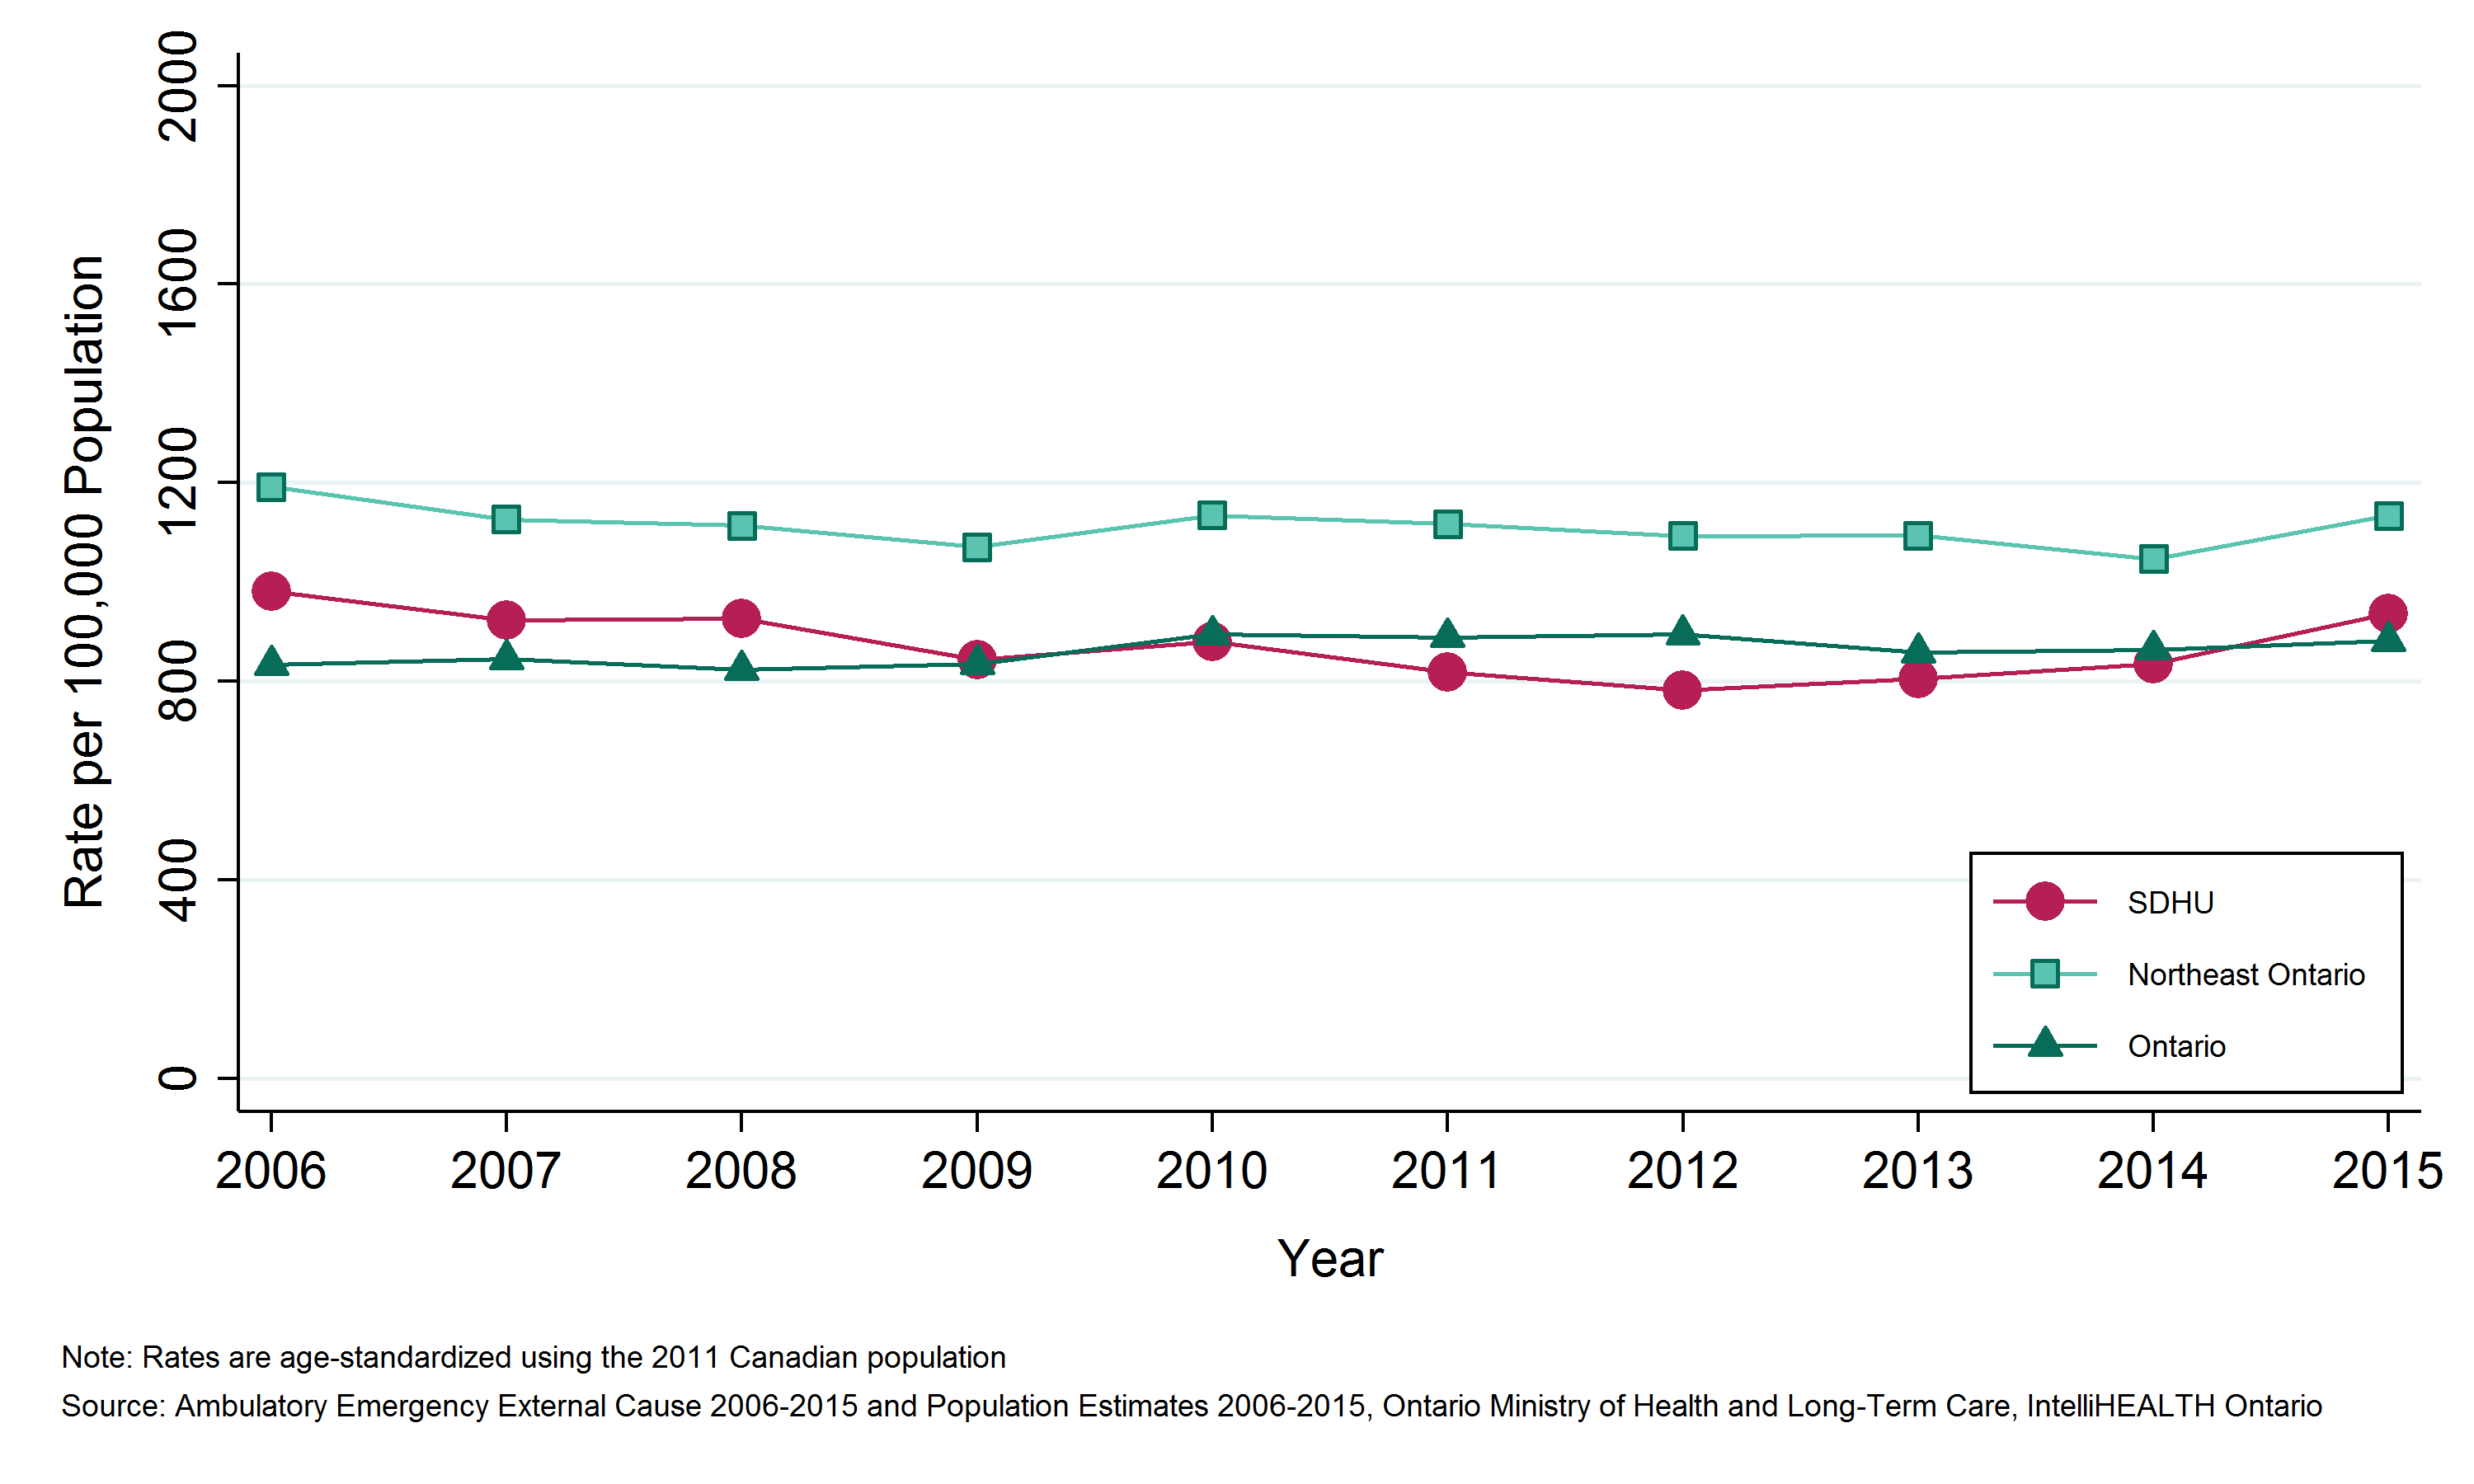
Emergency department (ED) visits due to sports-related injuries by geographic region
Key Findings:
- Among residents of the Sudbury & District Health Unit (SDHU) area, there were 1,694 emergency department (ED) visits due to sports-related injuries in 2015.
- In 2015, the ED visits rate due to sports-related injuries in the SDHU area was 937 per 100,000 population per year.
- The rate of ED visits due to sports-related injuries in the SDHU area has been consistently lower than that of northeastern Ontario, yet similar to the Ontario overall rate, with some fluctuations.
- Between 2006 and 2015, there was no clear trend in the rate of ED visits due to sports-related injuries in the SDHU area.
Notes:
- Geographic areas and/or time periods in which there is less access to walk-in clinics and other alternatives to the local ED can be expected to have higher rates of injury-related ED visits than they would otherwise.
- Rates are age-standardized using the 2011 Canadian population.
- Data Source: Ambulatory Emergency External Cause 2006 to 2015 (extracted June 6, 2016) and Population Estimates 2006 to 2015 (extracted October 7, 2016), Ontario Ministry of Health and Long-Term Care, IntelliHEALTH Ontario.
Figure: Annual age-standardized rate of emergency department visits, sports-related injuries, by geographic region, 2006 to 2015
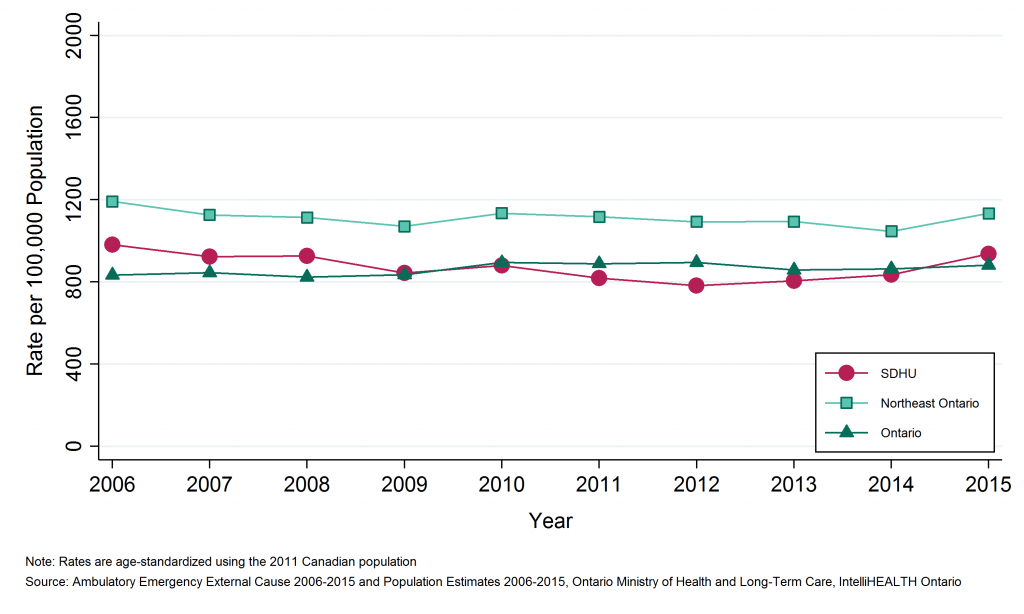
Table: Annual age-standardized rate of emergency department visits, sports-related injuries, by geographic region, 2006 to 2015
| Geographic Region | 2006 | 2007 | 2008 | 2009 | 2010 | 2011 | 2012 | 2013 | 2014 | 2015 |
| SDHU | 982.2 | 923.2 | 926.3 | 844.3 | 880.2 | 818.8 | 781.9 | 806.2 | 835.2 | 936.5 |
| Northeast | 1,192.6 | 1,126.9 | 1,113.6 | 1,070.7 | 1,134.9 | 1,117.5 | 1,092.9 | 1,094.4 | 1,046.8 | 1,133.9 |
| Ontario | 834.2 | 845.8 | 824.0 | 835.9 | 894.6 | 889.4 | 895.2 | 858.3 | 864.5 | 882.5 |
Table: Annual number of emergency department visits, sports-related injuries, by geographic region, 2006 to 2015
| Geographic Region | 2006 | 2007 | 2008 | 2009 | 2010 | 2011 | 2012 | 2013 | 2014 | 2015 |
| SDHU | 2,036 | 1,889 | 1,885 | 1,690 | 1,727 | 1,581 | 1,488 | 1,506 | 1,536 | 1,694 |
| Northeast | 6,982 | 6,513 | 6,332 | 5,975 | 6,227 | 6,021 | 5,794 | 5,690 | 5,353 | 5,713 |
| Ontario | 113,209 | 114,596 | 111,570 | 113,055 | 121,026 | 120,220 | 120,940 | 115,698 | 116,492 | 118,614 |
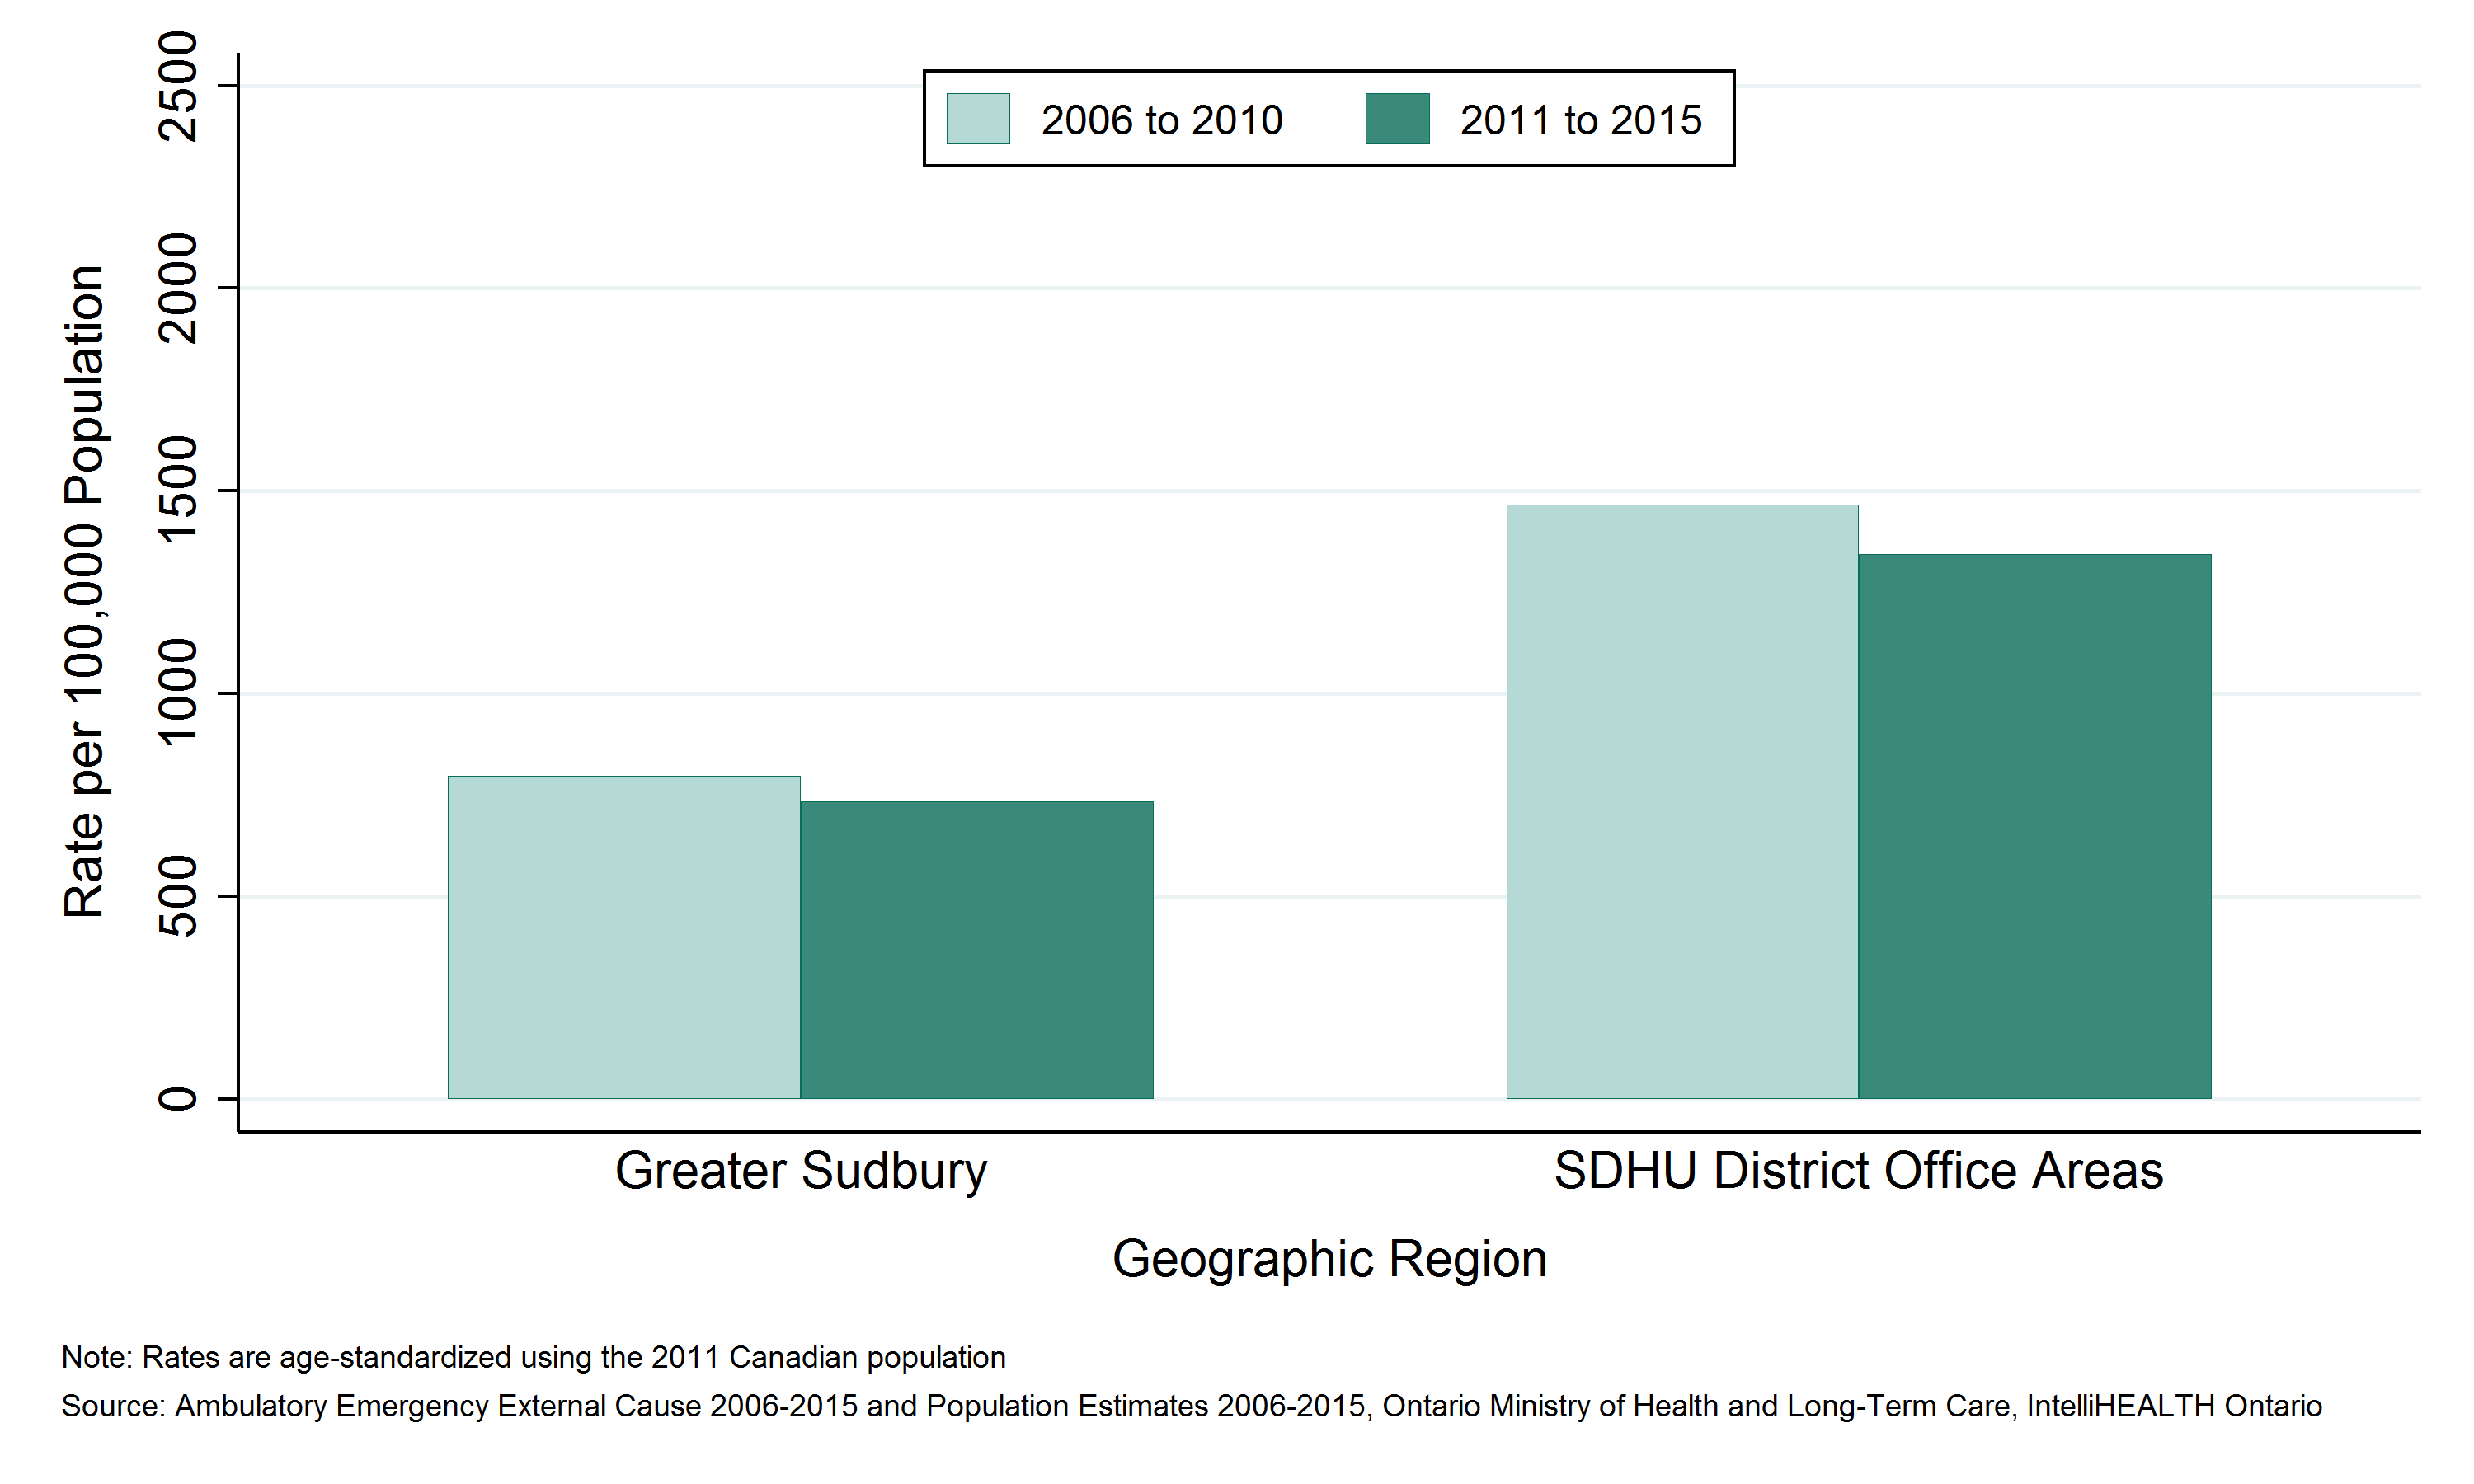
Emergency department (ED) visits due to sports-related injuries by Greater Sudbury and outlying areas
Key Findings:
- Between 2011 and 2015, there were 5,750 emergency department (ED) visits due to sports-related injuries among residents of Greater Sudbury and 2,055 among residents of the SDHU district office areas, an average of 1,150 and 411 per year, respectively.
- The rate of ED visits due to sports-related injuries was 735 per 100,000 population per year in Greater Sudbury and 1,345 per 100,000 population per year in the SDHU district office areas between 2011 and 2015.
- The rate of ED visits due to sports-related injuries among residents of Greater Sudbury has been consistently lower than among residents in the SDHU district office areas.
- The rates of ED visits due to sports-related injuries among residents in both Greater Sudbury and the SDHU district office areas decreased slightly between 2006 to 2010 and 2011 to 2015.
Notes:
- Geographic areas and/or time periods in which there is less access to walk-in clinics and other alternatives to the local ED can be expected to have higher rates of injury-related ED visits than they would otherwise.
- Rates are age-standardized using the 2011 Canadian population.
- Data Source: Ambulatory Emergency External Cause 2006 to 2015 (extracted June 6, 2016) and Population Estimates 2006 to 2015 (extracted October 7, 2016), Ontario Ministry of Health and Long-Term Care, IntelliHEALTH Ontario.
Figure: Annual age-standardized rate of emergency department visits, sports-related injuries, by Greater Sudbury and outlying areas, 2006 to 2010 and 2011 to 2015

Table: Annual age-standardized rate of emergency department visits, sports-related injuries, by Greater Sudbury and outlying areas, 2006 to 2010 and 2011 to 2015
| Geographic Region | Rate per 100000 2006 to 2010 | Rate per 100000 2011 to 2015 |
| Greater Sudbury | 797.9 | 734.6 |
| SDHU District Office Areas | 1,466.6 | 1,344.7 |
Table: Annual number of emergency department visits, sports-related injuries, by Greater Sudbury and outlying areas, 2006 to 2010 and 2011 to 2015
| Geographic Region | Total Counts, 2006 to 2010 | Total Counts, 2011 to 2015 | Average Annual Counts, 2006 to 2010 | Average Annual Counts, 2011 to 2015 |
| Greater Sudbury | 6,693 | 5,750 | 1,338.6 | 1,150.0 |
| SDHU District Office Areas | 2,534 | 2,055 | 506.8 | 411.0 |
Emergency department (ED) visits due to sports-related injuries by sex
Key Findings:
- Between 2011 and 2015, there were 5,312 emergency department (ED) visits due to sports-related injuries among males, and 2,493 among females in the Sudbury & District Health Unit (SDHU) area, an average of 1,062 and 499 per year, respectively.
- The rate of ED visits due to sports-related injuries was 1,112 per 100,000 males per year and 547 per 100,000 females per year in the SDHU area between 2011 and 2015.
- The ED visits rate due to sports-related injuries among males has been consistently higher than the rate among females.
- In the SDHU area, the rate of ED visits due to sports-related injuries decreased among males and remained stable among females over time between 2006 to 2010 and 2011 to 2015.
Notes:
- Geographic areas and/or time periods in which there is less access to walk-in clinics and other alternatives to the local ED can be expected to have higher rates of injury-related ED visits than they would otherwise.
- Rates are age-standardized using the 2011 Canadian population.
- Data Source: Ambulatory Emergency External Cause 2006 to 2015 (extracted June 6, 2016) and Population Estimates 2006 to 2015 (extracted October 7, 2016), Ontario Ministry of Health and Long-Term Care, IntelliHEALTH Ontario.
Figure: Annual age-standardized rate of emergency department visits, sports-related injuries, by sex, SDHU, 2006 to 2010 and 2011 to 2015
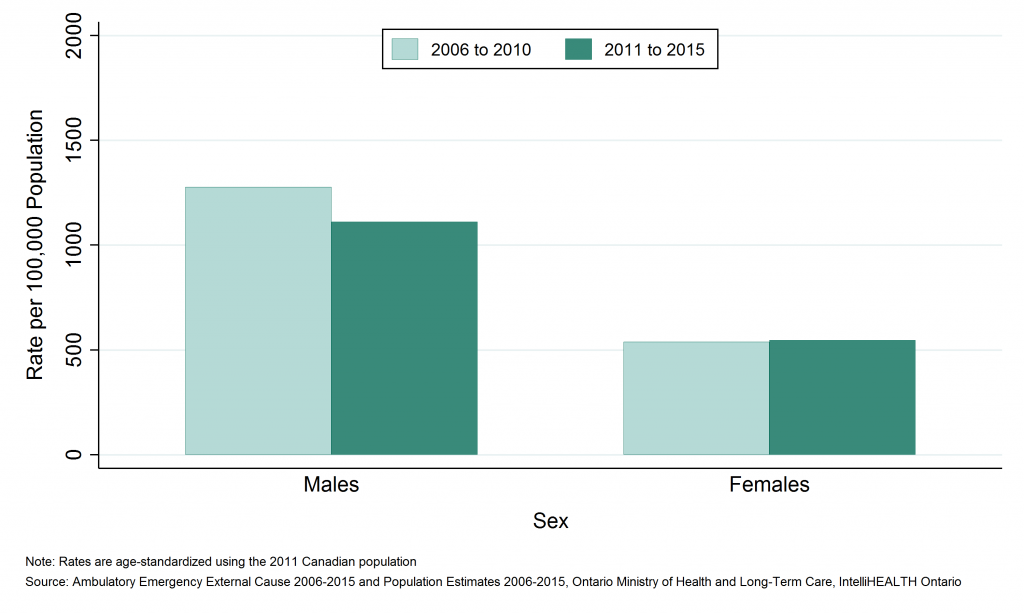
Table: Annual age-standardized rate of emergency department visits, sports-related injuries, by sex, SDHU, 2006 to 2010 and 2011 to 2015
| Sex | Rate per 100,000, 2006 to 2010 | Rate per 100,000, 2011 to 2015 |
| Males | 1,276.7 | 1,111.5 |
| Females | 539.1 | 546.5 |
Table: Annual number of emergency department visits, sports-related injuries, by sex, SDHU, 2006 to 2010 and 2011 to 2015
| Sex | Total Counts, 2006 to 2010 | Total Counts, 2011 to 2015 | Average Annual Counts, 2006 to 2010 | Average Annual Counts, 2011 to 2015 |
| Males | 6,562 | 5,312 | 1,312.4 | 1,062.4 |
| Females | 2,665 | 2,493 | 533.0 | 498.6 |
Emergency department (ED) visits due to sports-related injuries by age group
Key Findings:
- Among residents of the Sudbury & District Health Unit (SDHU) area, the 15 to 24 age group visited the emergency department (ED) due to sports-related injuries the most, with 2,470 ED visits between 2011 and 2015, or 494 ED visits per year on average.
- Between 2011 and 2015, the 10 to 14 age group had the highest ED visit rate for sports-related injuries with 4,339 ED visits per 100,000 population per year.
- Rates of ED visits due to sports-related injuries are higher in children, youth and young adults. They peak at ages 10 to 14, then decrease with age.
- In the SDHU area, the ED visits rate due to sports-related injuries decreased in the 10 to 14 and 15 to 24 year age groups between 2006 to 2010 and 2011 to 2015, with a smaller decrease in among ages 0 to 9 years. Rates have remained stable for all other age groups.
Notes:
- Geographic areas and/or time periods in which there is less access to walk-in clinics and other alternatives to the local ED can be expected to have higher rates of injury-related ED visits than they would otherwise.
- Rates are age-standardized using the 2011 Canadian population.
- Data Source: Ambulatory Emergency External Cause 2006 to 2015 (extracted June 6, 2016) and Population Estimates 2006 to 2015 (extracted October 7, 2016), Ontario Ministry of Health and Long-Term Care, IntelliHEALTH Ontario.
Figure: Annual age-standardized rate of emergency department visits, sports-related injuries, by age group, SDHU, 2006 to 2010 and 2011 to 2015

Table: Annual age-standardized rate of emergency department visits, sports-related injuries, by age group, SDHU, 2006 to 2010 and 2011 to 2015
| Age Group | Rate per 100000, 2006 to 2010 | Rate per 100000, 2011 to 2015 |
| 0 to 9 | 1,275.6 | 1,176.9 |
| 10 to 14 | 4,657.9 | 4,339.0 |
| 15 to 24 | 2,226.4 | 1,918.6 |
| 25 to 44 | 579.5 | 528.6 |
| 45 to 64 | 204.9 | 195.5 |
| 65 to 74 | 70.9 | 61.2 |
| 75 to 84 | 42.1 | 36.7 |
| 85+ | 6.5 | 5.1 |
Table: Annual number of emergency department visits, sports-related injuries, by age group, SDHU, 2006 to 2010 and 2011 to 2015
| Age Group | Total Counts, 2006 to 2010 | Total Counts, 2011 to 2015 | Average Annual Counts, 2006 to 2010 | Average Annual Counts, 2011 to 2015 |
| 0 to 9 | 1,258 | 1,129 | 251.6 | 225.8 |
| 10 to 14 | 2,814 | 2,239 | 562.8 | 447.8 |
| 15 to 24 | 2,961 | 2,470 | 592.2 | 494.0 |
| 25 to 44 | 1,502 | 1,292 | 300.4 | 258.4 |
| 45 to 64 | 609 | 594 | 121.8 | 118.8 |
| 65 to 74 | 60 | 60 | 12.0 | 12.0 |
| 75 to 84 | 22 | 20 | 4.4 | 4.0 |
| 85+ | 1 | 1 | 0.2 | 0.2 |
Deaths due to sports-related injuries by geographic region
Key Findings:
- Among Sudbury & District Health Unit (SDHU) area residents, there were 13 deaths due to sports-related injuries between 2007 and 2011, an average of 3 per year.
- Between 2006 and 2015, the mortality rate due to sports-related injuries in the SDHU area was 1 death per 100,000 population per year.
- The mortality rate due to sports-related injuries in the SDHU area, northeastern Ontario, and Ontario were similar.
- Between 2002 to 2006 and 2007 to 2011, the mortality rate due to sports-related injuries in the SDHU remained stable.
Notes:
- Rates are age-standardized using the 2011 Canadian population.
- Data Source: Ontario Mortality Data 2002 to 2011 (extracted June 6, 2016) and Population Estimates 2006 to 2015 (extracted October 7, 2016), Ontario Ministry of Health and Long-Term Care, IntelliHEALTH Ontario.
Figure: Annual age-standardized mortality rate, sports-related injuries, by geographic region, 2002 to 2006 and 2007 to 2011
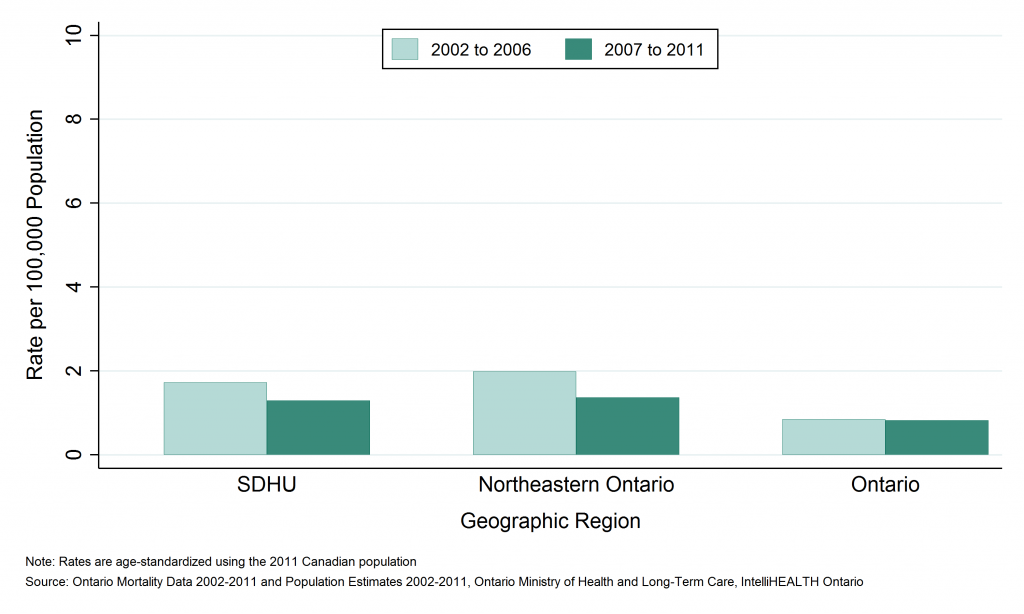
Table: Annual age-standardized mortality rate, sports-related injuries, by geographic region, 2002 to 2006 and 2007 to 2011
| Geographic Region | Rate per 100,000 2002 to 2006 | Rate per 100,000 2007 to 2011 |
| SDHU | 1.7 | 1.3 |
| Northeast | 2.0 | 1.4 |
| Ontario | 0.8 | 0.8 |
Table: Annual number of deaths, sports-related injuries, by geographic region, 2002 to 2006 and 2007 to 2011
| Geographic Region | Total Counts 2002 to 2006 | Total Counts 2007 to 2011 | Average Annual Counts, 2002 to 2006 | Average Annual Counts, 2007 to 2011 |
| SDHU | 17 | 13 | 3.4 | 2.6 |
| Northeast | 57 | 39 | 11.4 | 7.8 |
| Ontario | 520 | 530 | 104.0 | 106.0 |
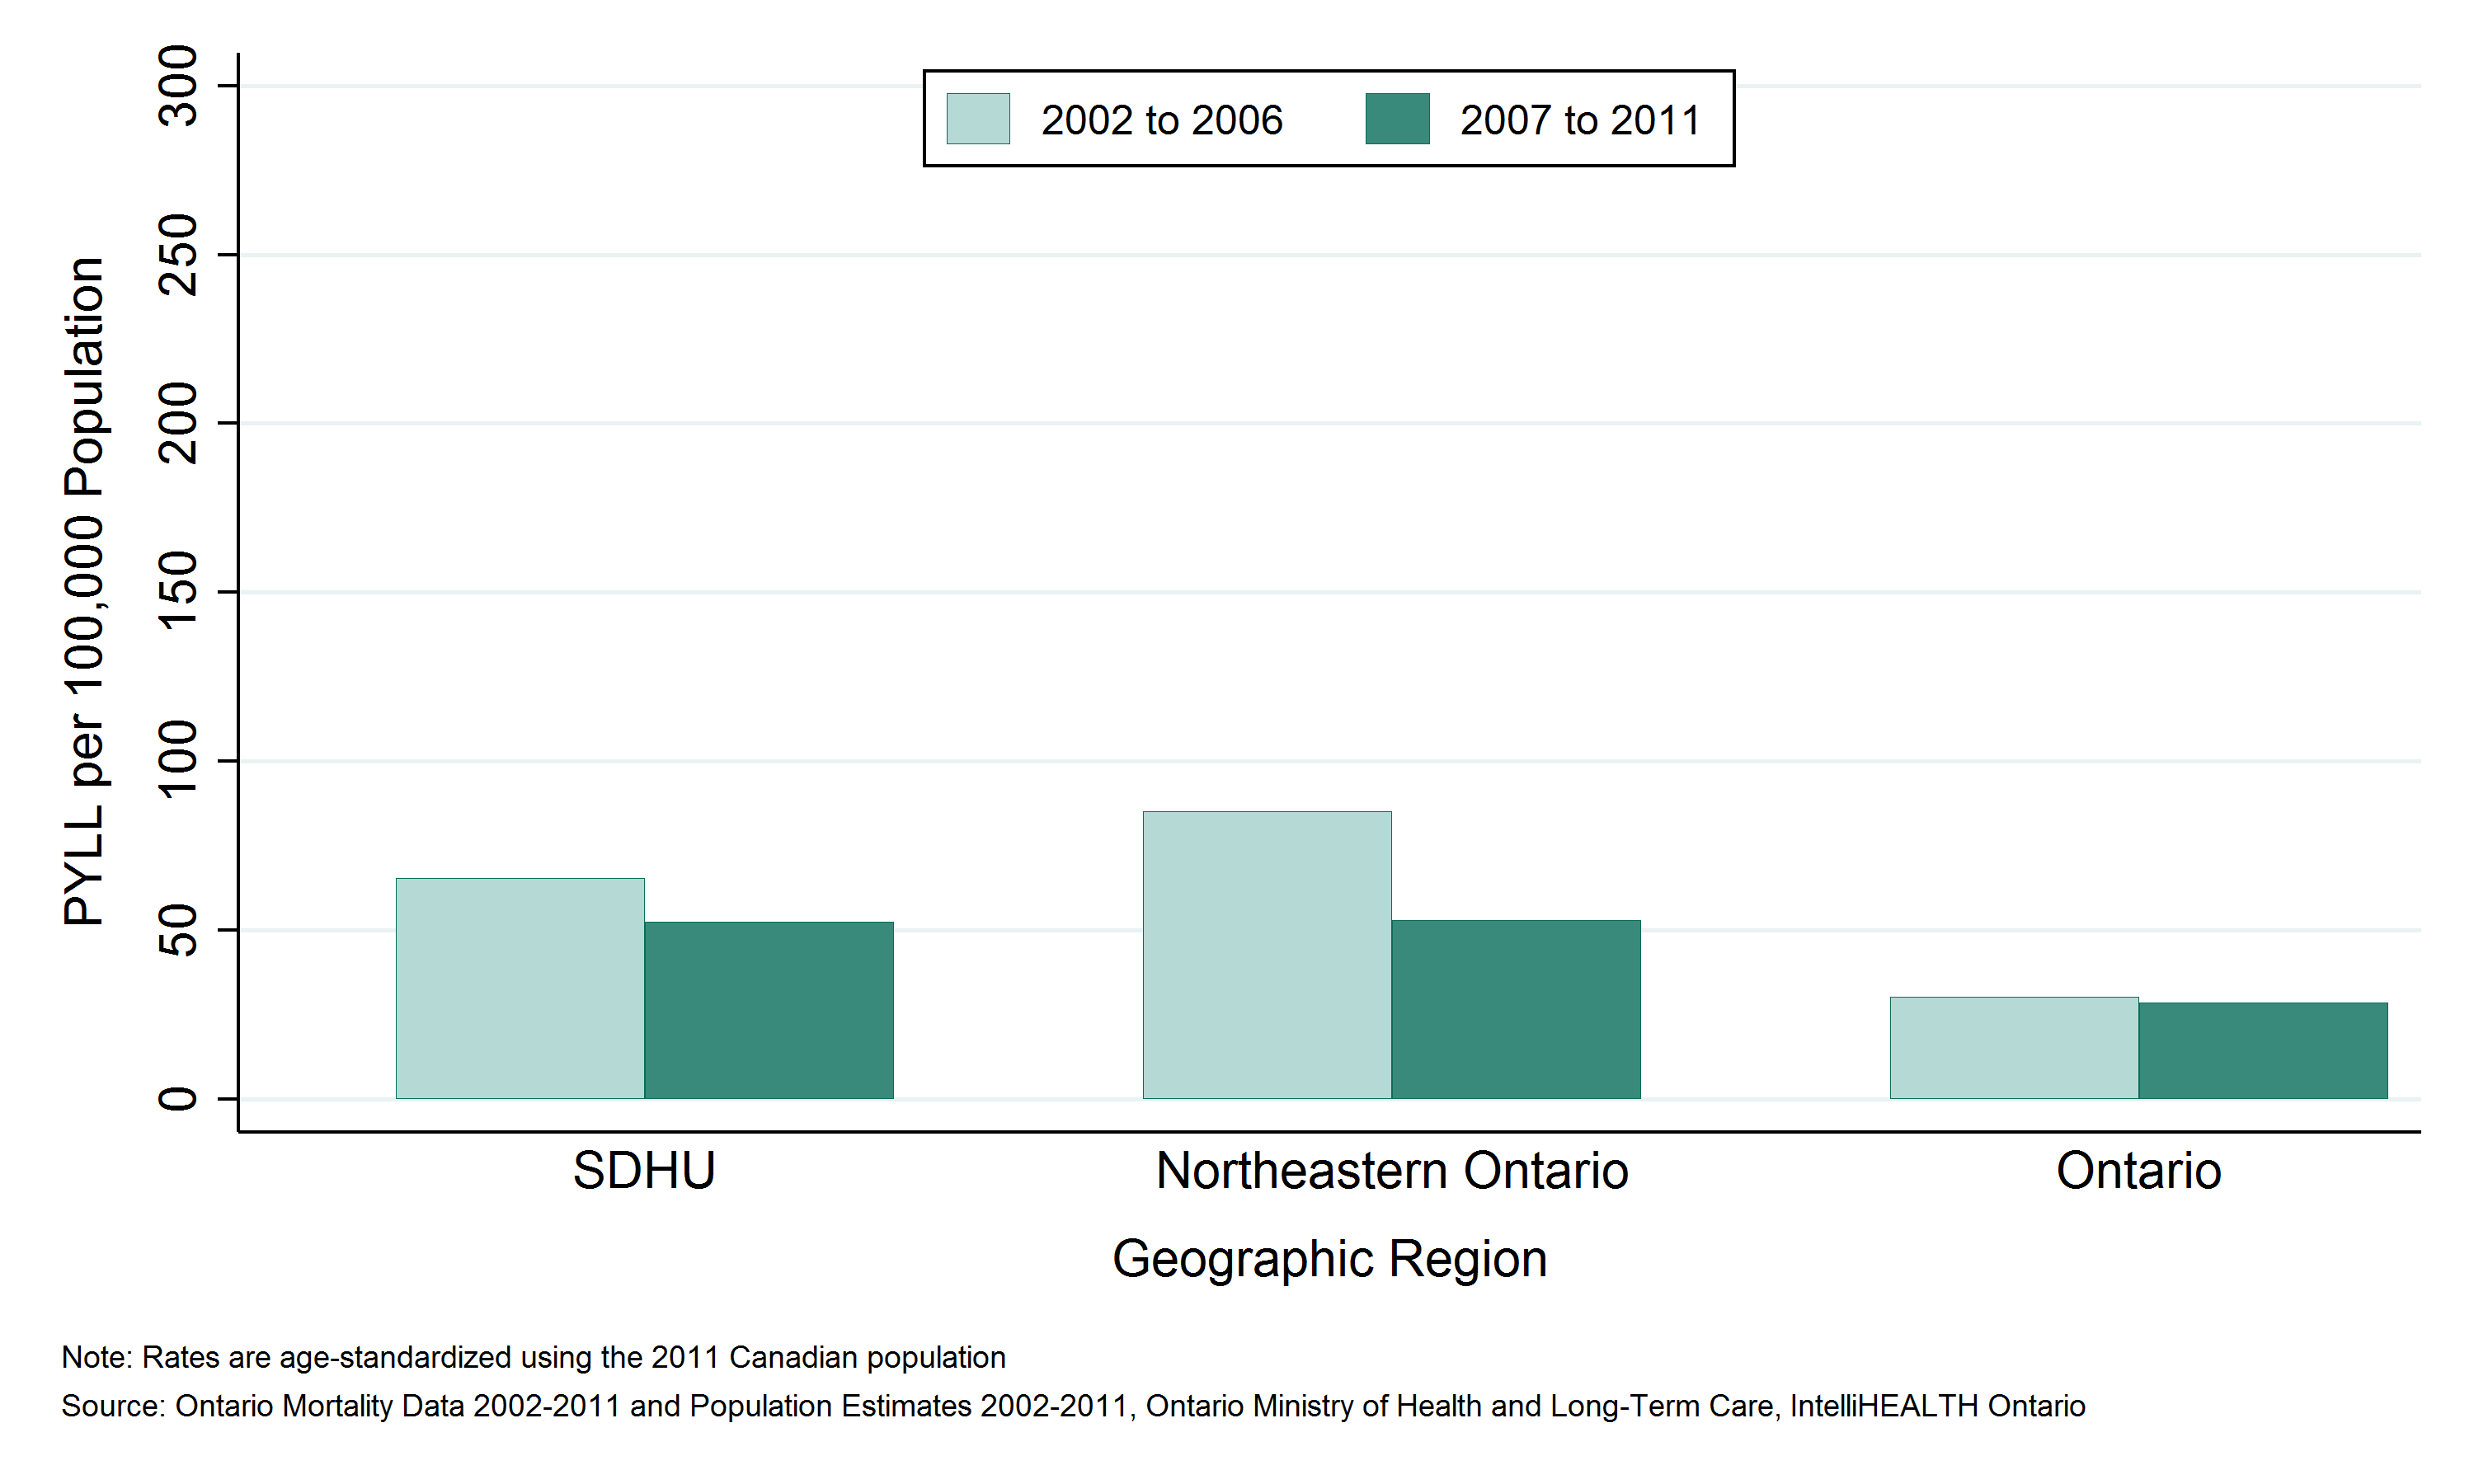
Potential years of life lost (PYLL) due to sports-related injuries by geographic region
Key Findings:
- Between 2006 and 2015, Sudbury & District Health Unit (SDHU) area residents lost 482 years of potential life due to deaths from sports-related injuries before the age of 75, an average of 96 per year.
- The rate of potential years of life lost (PYLL) in the SDHU area due to sports-related injuries was 53 PYLL per 100,000 population per year.
- The rate of PYLL due to sports-related injuries in the SDHU was similar to that in northeastern Ontario, while rates in both areas were higher than the rate in Ontario overall.
- Between 2002 to 2006 and 2007 to 2011, the rate of PYLL due to sports-related injuries in the SDHU area decreased slightly.
Notes:
- Rates are age-standardized using the 2011 Canadian population.
- Data Source: Ontario Mortality Data 2002 to 2011 (extracted June 6, 2016) and Population Estimates 2006 to 2015 (extracted October 7, 2016), Ontario Ministry of Health and Long-Term Care, IntelliHEALTH Ontario.
Figure: Annual age-standardized rate of potential years of life lost (PYLL), sports-related injuries, by geographic region, 2002 to 2006 and 2007 to 2011
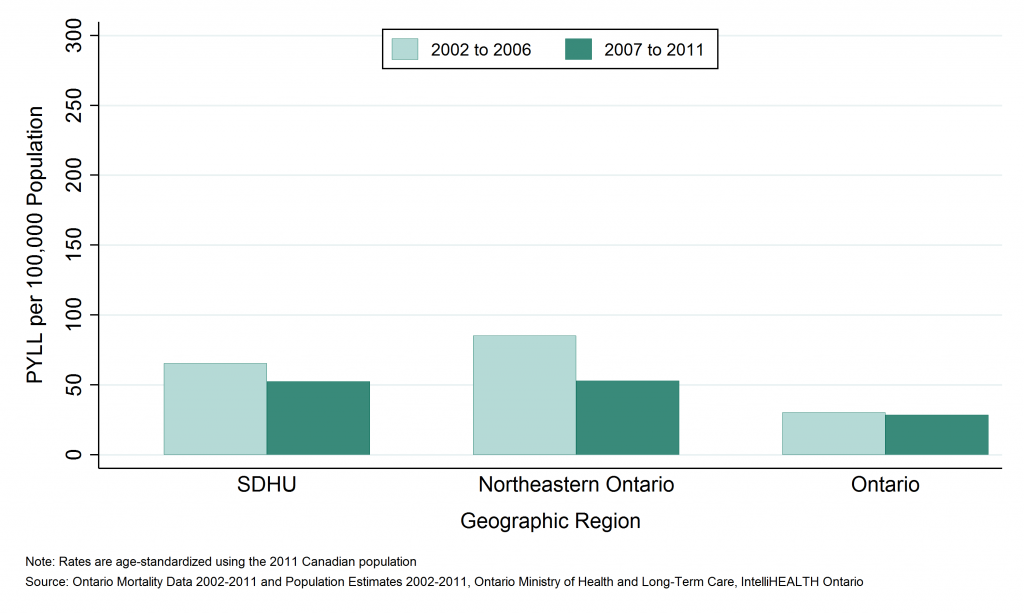
Table: Annual age-standardized rate of potential years of life lost (PYLL), sports-related injuries, by geographic region, 2002 to 2006 and 2007 to 2011
| Geographic Region | Rate per 100,000, 2002 to 2006 | Rate per 100,000, 2007 to 2011 |
| SDHU | 65.4 | 52.5 |
| Northeast | 85.1 | 53.1 |
| Ontario | 30.2 | 28.5 |
Table: Annual number of potential years of life lost (PYLL), sports-related injuries, by geographic region, 2002 to 2006 and 2007 to 2011
| Geographic Region | Total PYLL, 2002 to 2006 | Total PYLL, 2007 to 2011 | Average Annual Counts, 2002 to 2006 | Average Annual Counts, 2007 to 2011 |
| SDHU | 607 | 482 | 121.4 | 96.4 |
| Northeast | 2,293 | 1,380 | 458.6 | 276.0 |
| Ontario | 18,859 | 18,148 | 3,771.8 | 3,629.6 |
This item was last modified on March 17, 2025