Unintentional poisonings
This section includes negative health events resulting from unintentional poisoning by and exposure to noxious substances. It excludes assaults, intentional self-harm, and any adverse effects of drugs that were properly administered for medical purposes.
Emergency department (ED) visits due to unintentional poisonings by geographic region
Key Findings:
- Among residents of the Sudbury & District Health Unit (SDHU) area, there were 355 emergency department (ED) visits due to unintentional poisonings in 2015.
- In 2015, the ED visits rate due to unintentional poisonings in the SDHU was 185 per 100,000 population per year.
- The rate of ED visits due to unintentional poisonings in the SDHU area has been consistently higher than that of Ontario, yet lower than the rate for northeastern Ontario.
- Between 2006 and 2015, there was no clear trend in the ED visits rate due to unintentional poisonings in the SDHU area.
Notes:
- Geographic areas and/or time periods in which there is less access to walk-in clinics and other alternatives to the local ED can be expected to have higher rates of injury-related ED visits than they would otherwise.
- Rates are age-standardized using the 2011 Canadian population.
- Data Source: Ambulatory Emergency External Cause 2006 to 2015 (extracted June 6, 2016) and Population Estimates 2006 to 2015 (extracted October 7, 2016), Ontario Ministry of Health and Long-Term Care, IntelliHEALTH Ontario.
Figure: Annual age-standardized rate of emergency department visits, unintentional poisonings, by geographic region, 2006 to 2015
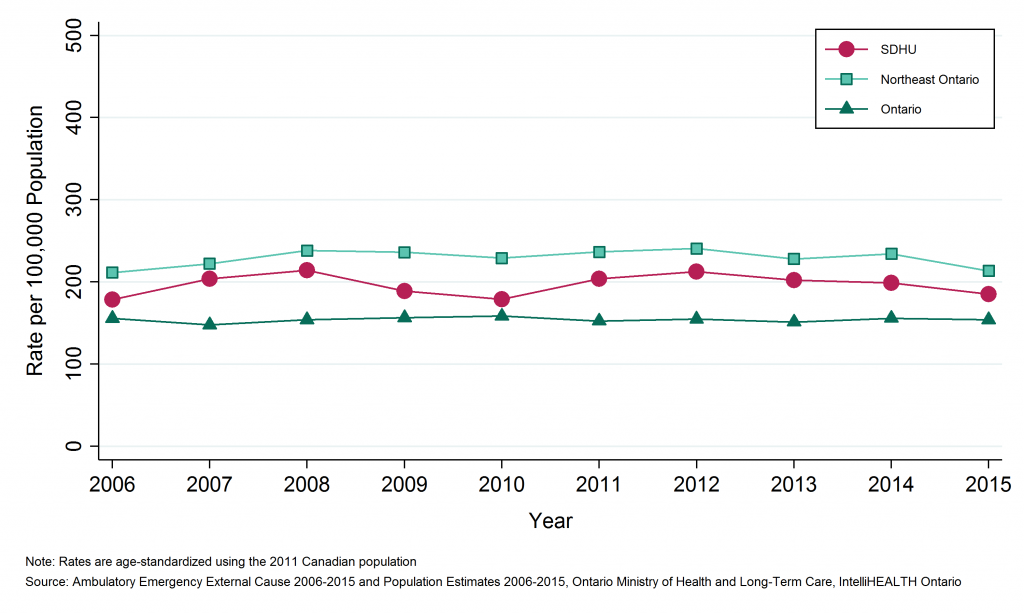
Table: Annual age-standardized rate of emergency department visits, unintentional poisonings, by geographic region, 2006 to 2015
| Geographic Region | 2006 | 2007 | 2008 | 2009 | 2010 | 2011 | 2012 | 2013 | 2014 | 2015 |
| SDHU | 178.4 | 204.1 | 214.1 | 188.9 | 179.0 | 203.7 | 212.5 | 202.4 | 198.8 | 185.3 |
| Northeast | 211.5 | 222.2 | 238.4 | 236.1 | 229.2 | 236.5 | 240.8 | 228.2 | 234.4 | 213.5 |
| Ontario | 155.9 | 147.8 | 154.1 | 156.6 | 158.5 | 152.6 | 154.9 | 151.4 | 156.0 | 154.1 |
Table: Annual number of emergency department visits, unintentional poisonings, by geographic region, 2006 to 2015
| Geographic Region | 2006 | 2007 | 2008 | 2009 | 2010 | 2011 | 2012 | 2013 | 2014 | 2015 |
| SDHU | 346 | 398 | 418 | 369 | 354 | 404 | 417 | 396 | 383 | 355 |
| Northeast | 1,164 | 1,231 | 1,319 | 1,300 | 1,271 | 1,315 | 1,326 | 1,252 | 1,268 | 1,161 |
| Ontario | 19,894 | 19,001 | 19,909 | 20,373 | 20,861 | 20,270 | 20,793 | 20,453 | 21,253 | 21,177 |
Emergency department (ED) visits due to unintentional poisonings by Greater Sudbury and outlying areas
Key Findings:
- Between 2011 and 2015, there were 1,580 emergency department (ED) visits due to unintentional poisonings among residents of Greater Sudbury and 375 among residents of the SDHU district office areas, an average of 316 and 75 per year, respectively.
- The rate of ED visits due to unintentional poisonings was 194 per 100,000 population per year in Greater Sudbury and 234 per 100,000 population per year in the SDHU district office areas between 2011 and 2015.
- The rate of ED visits due to unintentional poisonings among residents of Greater Sudbury has been consistently lower than among residents in the SDHU district office areas.
- The rate of ED visits due to unintentional poisonings among residents in Greater Sudbury remained relatively stable between 2006 to 2010 and 2011 to 2015, while the rate among residents of the SDHU district office areas decreased slightly.
Notes:
- Geographic areas and/or time periods in which there is less access to walk-in clinics and other alternatives to the local ED can be expected to have higher rates of injury-related ED visits than they would otherwise.
- Rates are age-standardized using the 2011 Canadian population.
- Data Source: Ambulatory Emergency External Cause 2006 to 2015 (extracted June 6, 2016) and Population Estimates 2006 to 2015 (extracted October 7, 2016), Ontario Ministry of Health and Long-Term Care, IntelliHEALTH Ontario.
Figure: Annual age-standardized rate of emergency department visits, unintentional poisonings, by Greater Sudbury and outlying areas, 2006 to 2010 and 2011 to 2015
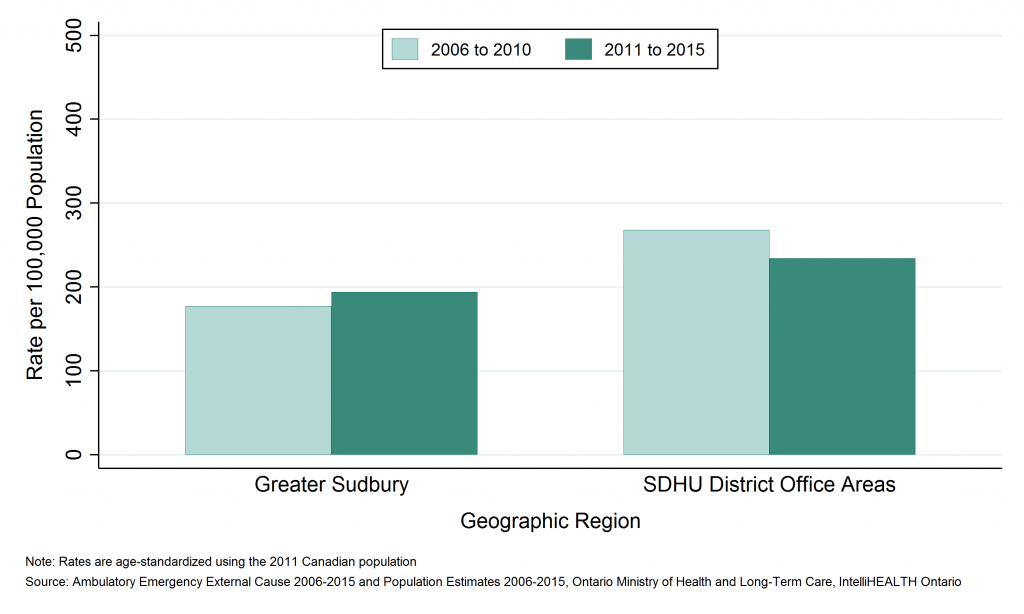
Table: Annual age-standardized rate of emergency department visits, unintentional poisonings, by Greater Sudbury and outlying areas, 2006 to 2010 and 2011 to 2015
| Geographic Region | Rate per 100000 2006 to 2010 | Rate per 100000 2011 to 2015 |
| Greater Sudbury | 177.4 | 194.0 |
| SDHU District Office Areas | 268.1 | 234.4 |
Table: Annual number of emergency department visits, unintentional poisonings, by Greater Sudbury and outlying areas, 2006 to 2010 and 2011 to 2015
| Geographic Region | Total Counts, 2006 to 2010 | Total Counts, 2011 to 2015 | Average Annual Counts, 2006 to 2010 | Average Annual Counts, 2011 to 2015 |
| Greater Sudbury | 1,440 | 1,580 | 288.0 | 316.0 |
| SDHU District Office Areas | 445 | 375 | 89.0 | 75.0 |
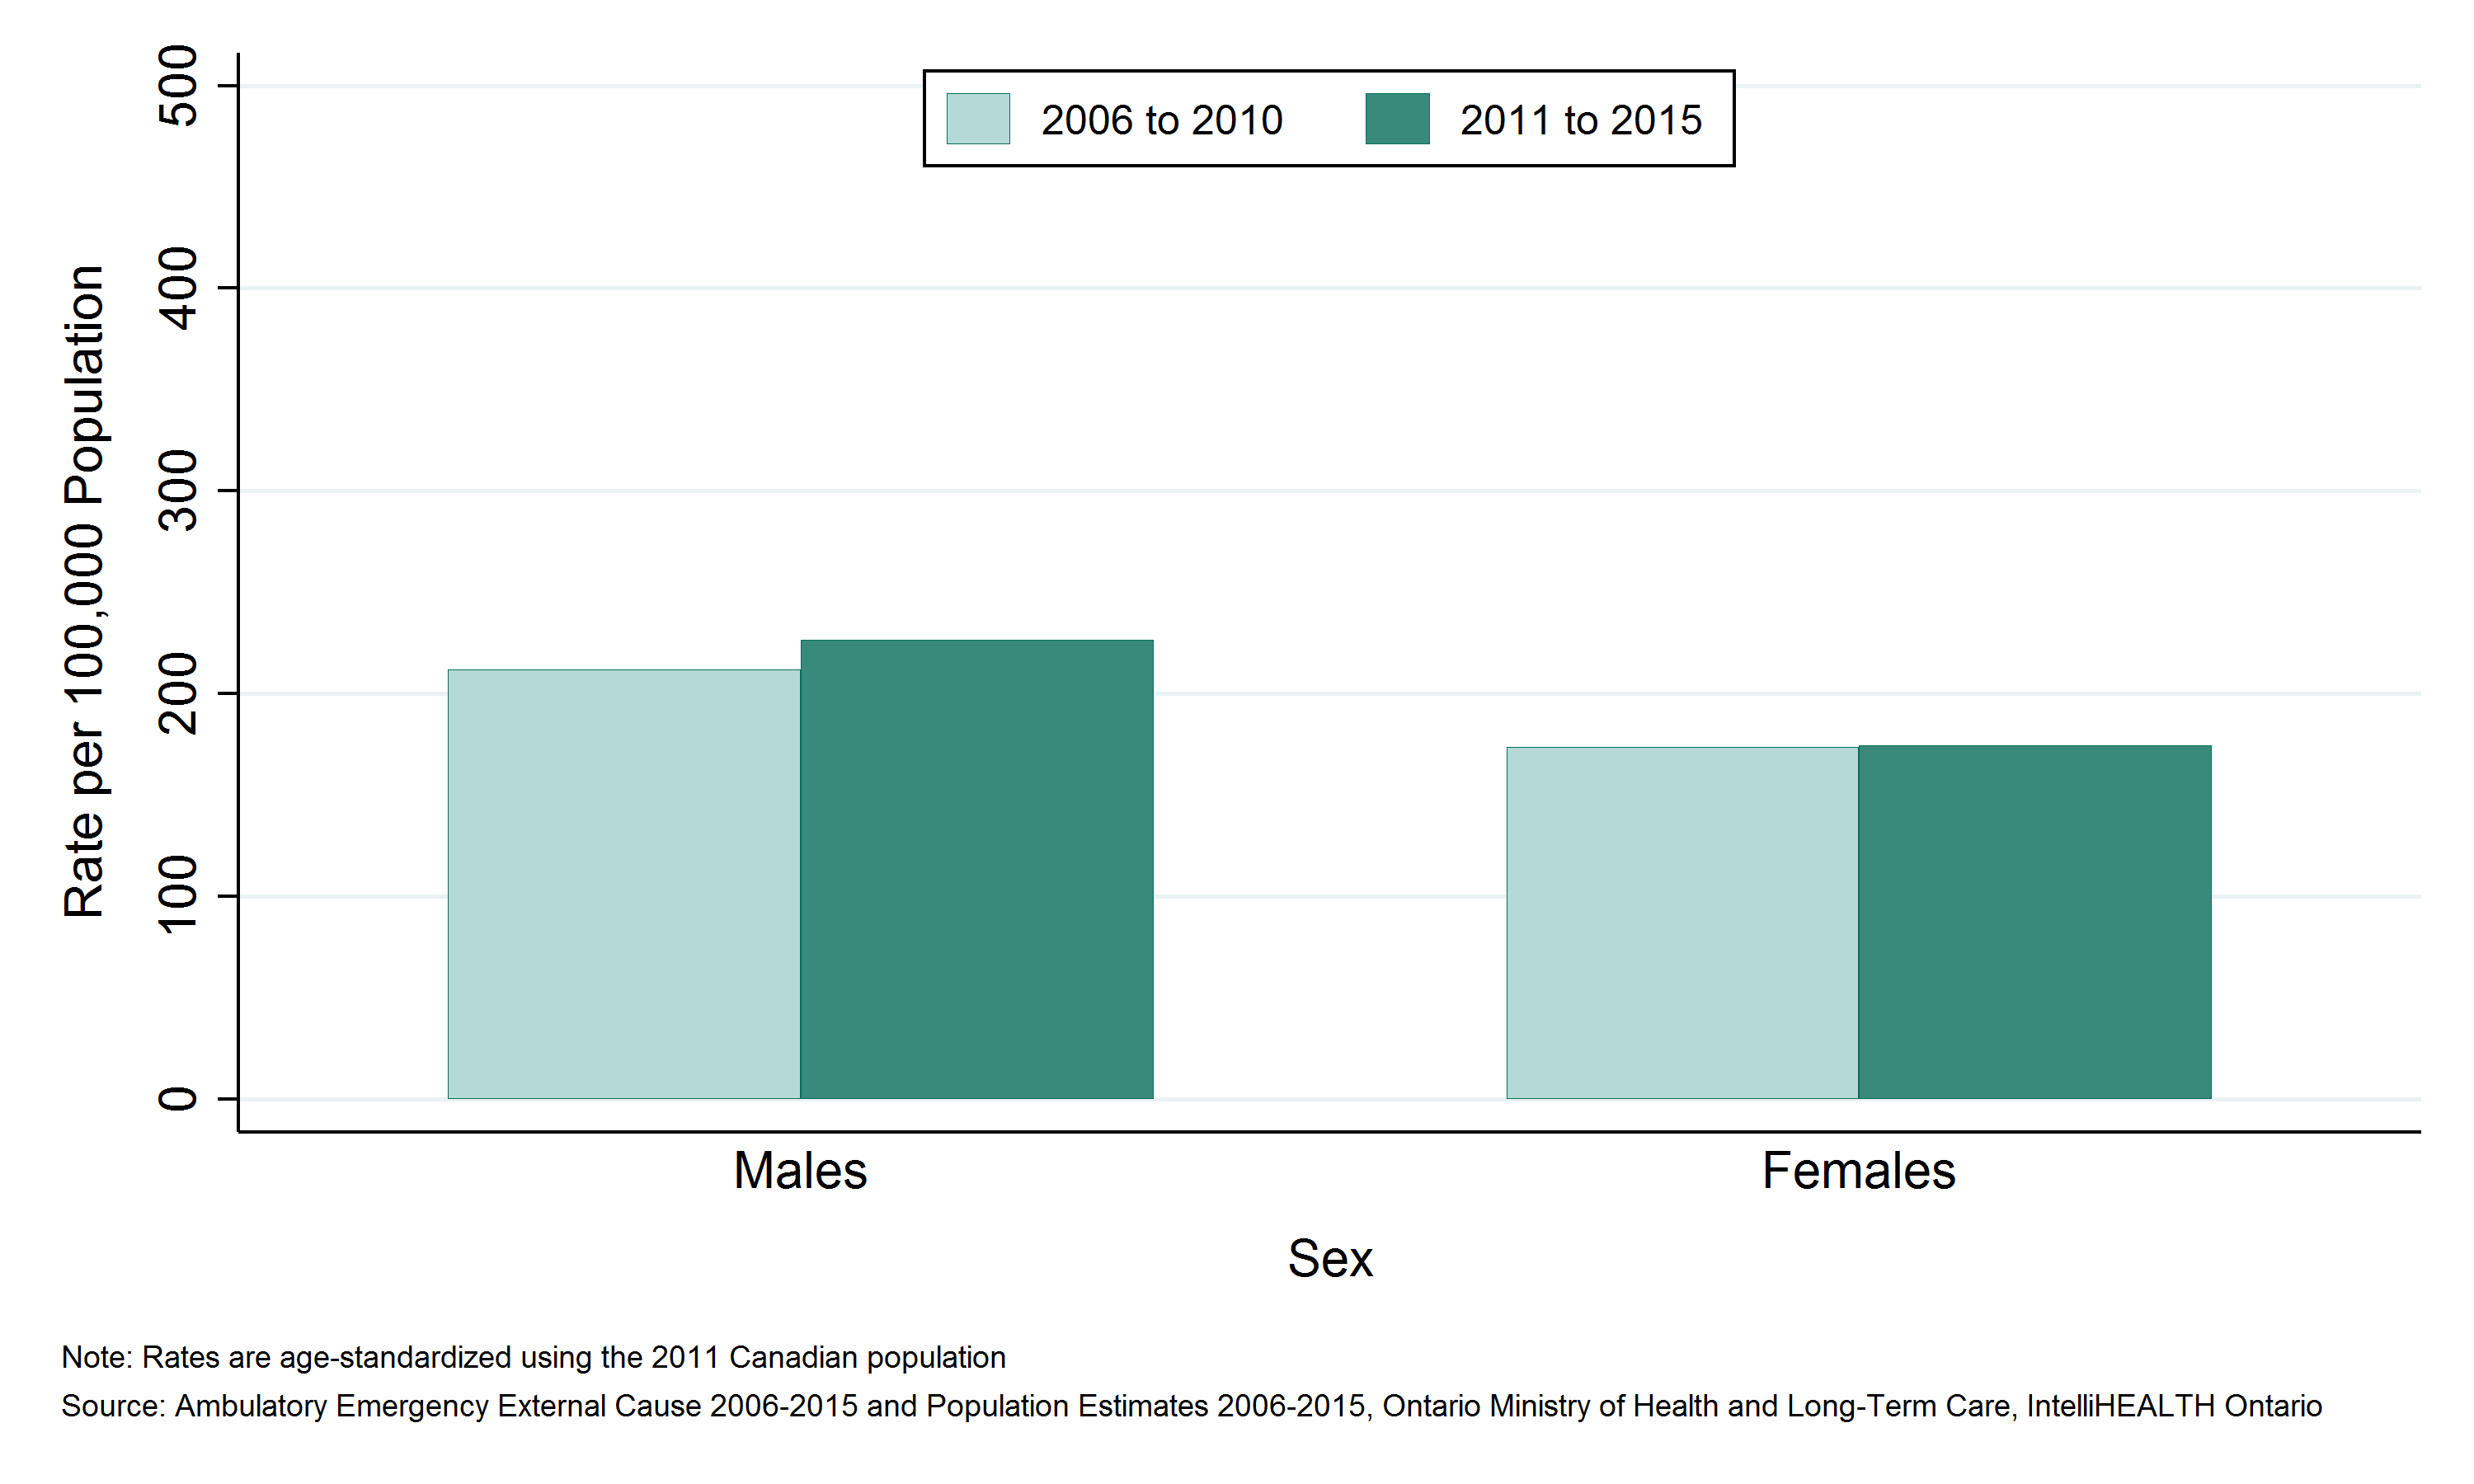
Emergency department (ED) visits due to unintentional poisonings by sex
Key Findings:
- Between 2011 and 2015, there were 1,095 emergency department (ED) visits due to unintentional poisonings among males, and 860 among females in the Sudbury & District Health Unit (SDHU) area, an average of 219 and 172 per year, respectively.
- The rate of ED visits due to unintentional poisonings was 226 per 100,000 males per year and 175 per 100,000 females per year in the SDHU area between 2011 and 2015.
- The ED visits rate due to unintentional poisonings has been slightly higher among SDHU-area males than among females.
- Among both males and females in the SDHU area, the rates of ED visits due to unintentional poisonings remained stable between 2006 to 2010 and 2011 to 2015.
Notes:
- Geographic areas and/or time periods in which there is less access to walk-in clinics and other alternatives to the local ED can be expected to have higher rates of injury-related ED visits than they would otherwise.
- Rates are age-standardized using the 2011 Canadian population.
- Data Source: Ambulatory Emergency External Cause 2006 to 2015 (extracted June 6, 2016) and Population Estimates 2006 to 2015 (extracted October 7, 2016), Ontario Ministry of Health and Long-Term Care, IntelliHEALTH Ontario.
Figure: Annual age-standardized rate of emergency department visits, unintentional poisonings, by sex, SDHU, 2006 to 2010 and 2011 to 2015

Table: Annual age-standardized rate of emergency department visits, unintentional poisonings, by sex, SDHU, 2006 to 2010 and 2011 to 2015
| Sex | Rate per 100,000, 2006 to 2010 | Rate per 100,000, 2011 to 2015 |
| Males | 212.0 | 226.4 |
| Females | 173.7 | 174.5 |
Table: Annual number of emergency department visits, unintentional poisonings, by sex, SDHU, 2006 to 2010 and 2011 to 2015
| Sex | Total Counts, 2006 to 2010 | Total Counts, 2011 to 2015 | Average Annual Counts, 2006 to 2010 | Average Annual Counts, 2011 to 2015 |
| Males | 1,031 | 1,095 | 206.2 | 219.0 |
| Females | 854 | 860 | 170.8 | 172.0 |
Emergency department (ED) visits due to unintentional poisonings by age group
Key Findings:
- Among residents of the Sudbury & District Health Unit (SDHU) area, the 25 to 44 age group visited the emergency department (ED) due to unintentional poisonings the most, with 535 ED visits between 2011 and 2015, or 107 ED visits per year on average.
- Between 2011 and 2015, the 0 to 9 age group had the highest ED visits rate due to unintentional poisonings with 291 ED visits per 100,000 population per year.
- In the SDHU area, rates of ED visits due to unintentional poisonings were highest among children and youth, with the exception of the 10 to 14 year age group in which rates were low. Rates decrease with age through adulthood, and then increase slightly in seniors aged 85 and older.
- Between 2006 to 2010 and 2011 to 2015, ED visits rate due to unintentional poisonings decreased in both the 0 to 9 and 85 and over age groups, increased in the 10 to 14, 15 to 24, and 45 to 64 year age groups, and remained stable for all other age groups.
Notes:
- Geographic areas and/or time periods in which there is less access to walk-in clinics and other alternatives to the local ED can be expected to have higher rates of injury-related ED visits than they would otherwise.
- Data Source: Ambulatory Emergency External Cause 2006 to 2015 (extracted June 6, 2016) and Population Estimates 2006 to 2015 (extracted October 7, 2016), Ontario Ministry of Health and Long-Term Care, IntelliHEALTH Ontario.
Figure: Annual rate of emergency department visits, unintentional poisonings, by age group, SDHU, 2006 to 2010 and 2011 to 2015
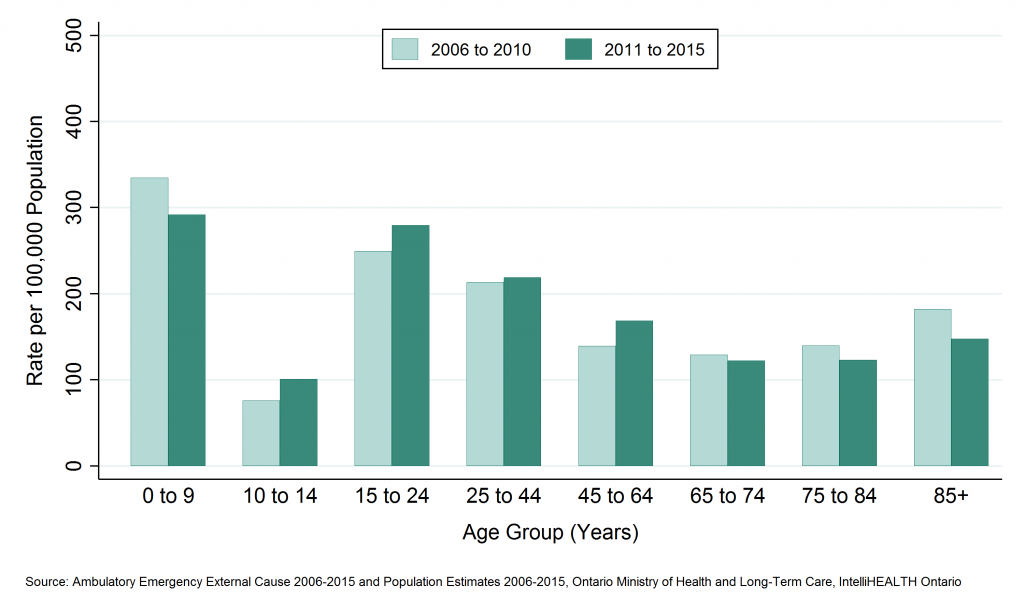
Table: Annual rate of emergency department visits, unintentional poisonings, by age group, SDHU, 2006 to 2010 and 2011 to 2015
| Age Group | Rate per 100000, 2006 to 2010 | Rate per 100000, 2011 to 2015 |
| 0 to 9 | 334.6 | 291.9 |
| 10 to 14 | 76.1 | 100.8 |
| 15 to 24 | 249.6 | 279.6 |
| 25 to 44 | 213.4 | 218.9 |
| 45 to 64 | 139.3 | 168.5 |
| 65 to 74 | 128.9 | 122.5 |
| 75 to 84 | 139.6 | 123.0 |
| 85+ | 181.9 | 147.5 |
Table: Annual number of emergency department visits, unintentional poisonings, by age group, SDHU, 2006 to 2010 and 2011 to 2015
| Age Group | Total Counts, 2006 to 2010 | Total Counts, 2011 to 2015 | Average Annual Counts, 2006 to 2010 | Average Annual Counts, 2011 to 2015 |
| 0 to 9 | 330 | 280 | 66.0 | 56.0 |
| 10 to 14 | 46 | 52 | 9.2 | 10.4 |
| 15 to 24 | 332 | 360 | 66.4 | 72.0 |
| 25 to 44 | 553 | 535 | 110.6 | 107.0 |
| 45 to 64 | 414 | 512 | 82.8 | 102.4 |
| 65 to 74 | 109 | 120 | 21.8 | 24.0 |
| 75 to 84 | 73 | 67 | 14.6 | 13.4 |
| 85+ | 28 | 29 | 5.6 | 5.8 |
Deaths due to unintentional poisonings by geographic region
Key Findings:
- Among residents of the Sudbury & District Health Unit (SDHU) area, there were 94 deaths due to unintentional poisonings between 2007 and 2011, an average of 19 per year.
- Between 2006 and 2015, the mortality rate due to unintentional poisonings in the SDHU area was 9 deaths per 100,000 population per year.
- The mortality rate due to unintentional poisonings in the SDHU area was similar to that in northeastern Ontario, with rates in both areas being higher than the rate in Ontario overall.
- Between 2002 to 2006 and 2007 to 2011, the mortality rate due to unintentional poisonings in the SDHU area increased.
Notes:
- Rates are age-standardized using the 2011 Canadian population.
- Data Source: Ontario Mortality Data 2002 to 2011 (extracted June 6, 2016) and Population Estimates 2006 to 2015 (extracted October 7, 2016), Ontario Ministry of Health and Long-Term Care, IntelliHEALTH Ontario
Figure: Annual age-standardized mortality rate, unintentional poisonings, by geographic region, 2002 to 2006 and 2007 to 2011
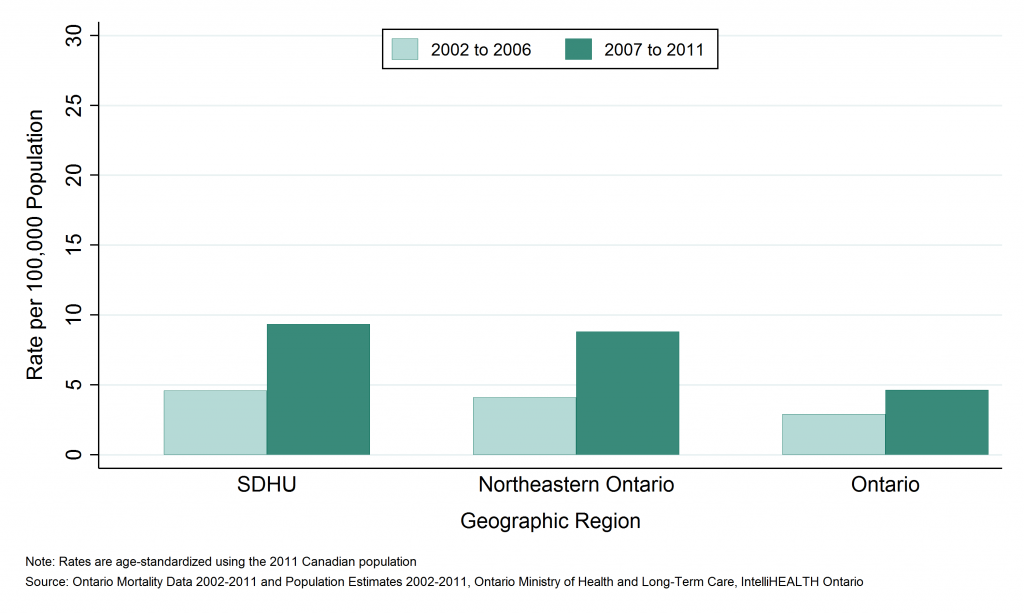
Table: Annual age-standardized mortality rate, unintentional poisonings, by geographic region, 2002 to 2006 and 2007 to 2011
| Geographic Region | Rate per 100,000 2002 to 2006 | Rate per 100,000 2007 to 2011 |
| SDHU | 4.6 | 9.3 |
| Northeast | 4.1 | 8.8 |
| Ontario | 2.9 | 4.6 |
Table: Annual number of deaths, unintentional poisonings, by geographic region, 2002 to 2006 and 2007 to 2011
| Geographic Region | Total Counts 2002 to 2006 | Total Counts 2007 to 2011 | Average Annual Counts, 2002 to 2006 | Average Annual Counts, 2007 to 2011 |
| SDHU | 46 | 94 | 9.2 | 18.8 |
| Northeast | 117 | 251 | 23.4 | 50.2 |
| Ontario | 1,802 | 3,027 | 360.4 | 605.4 |
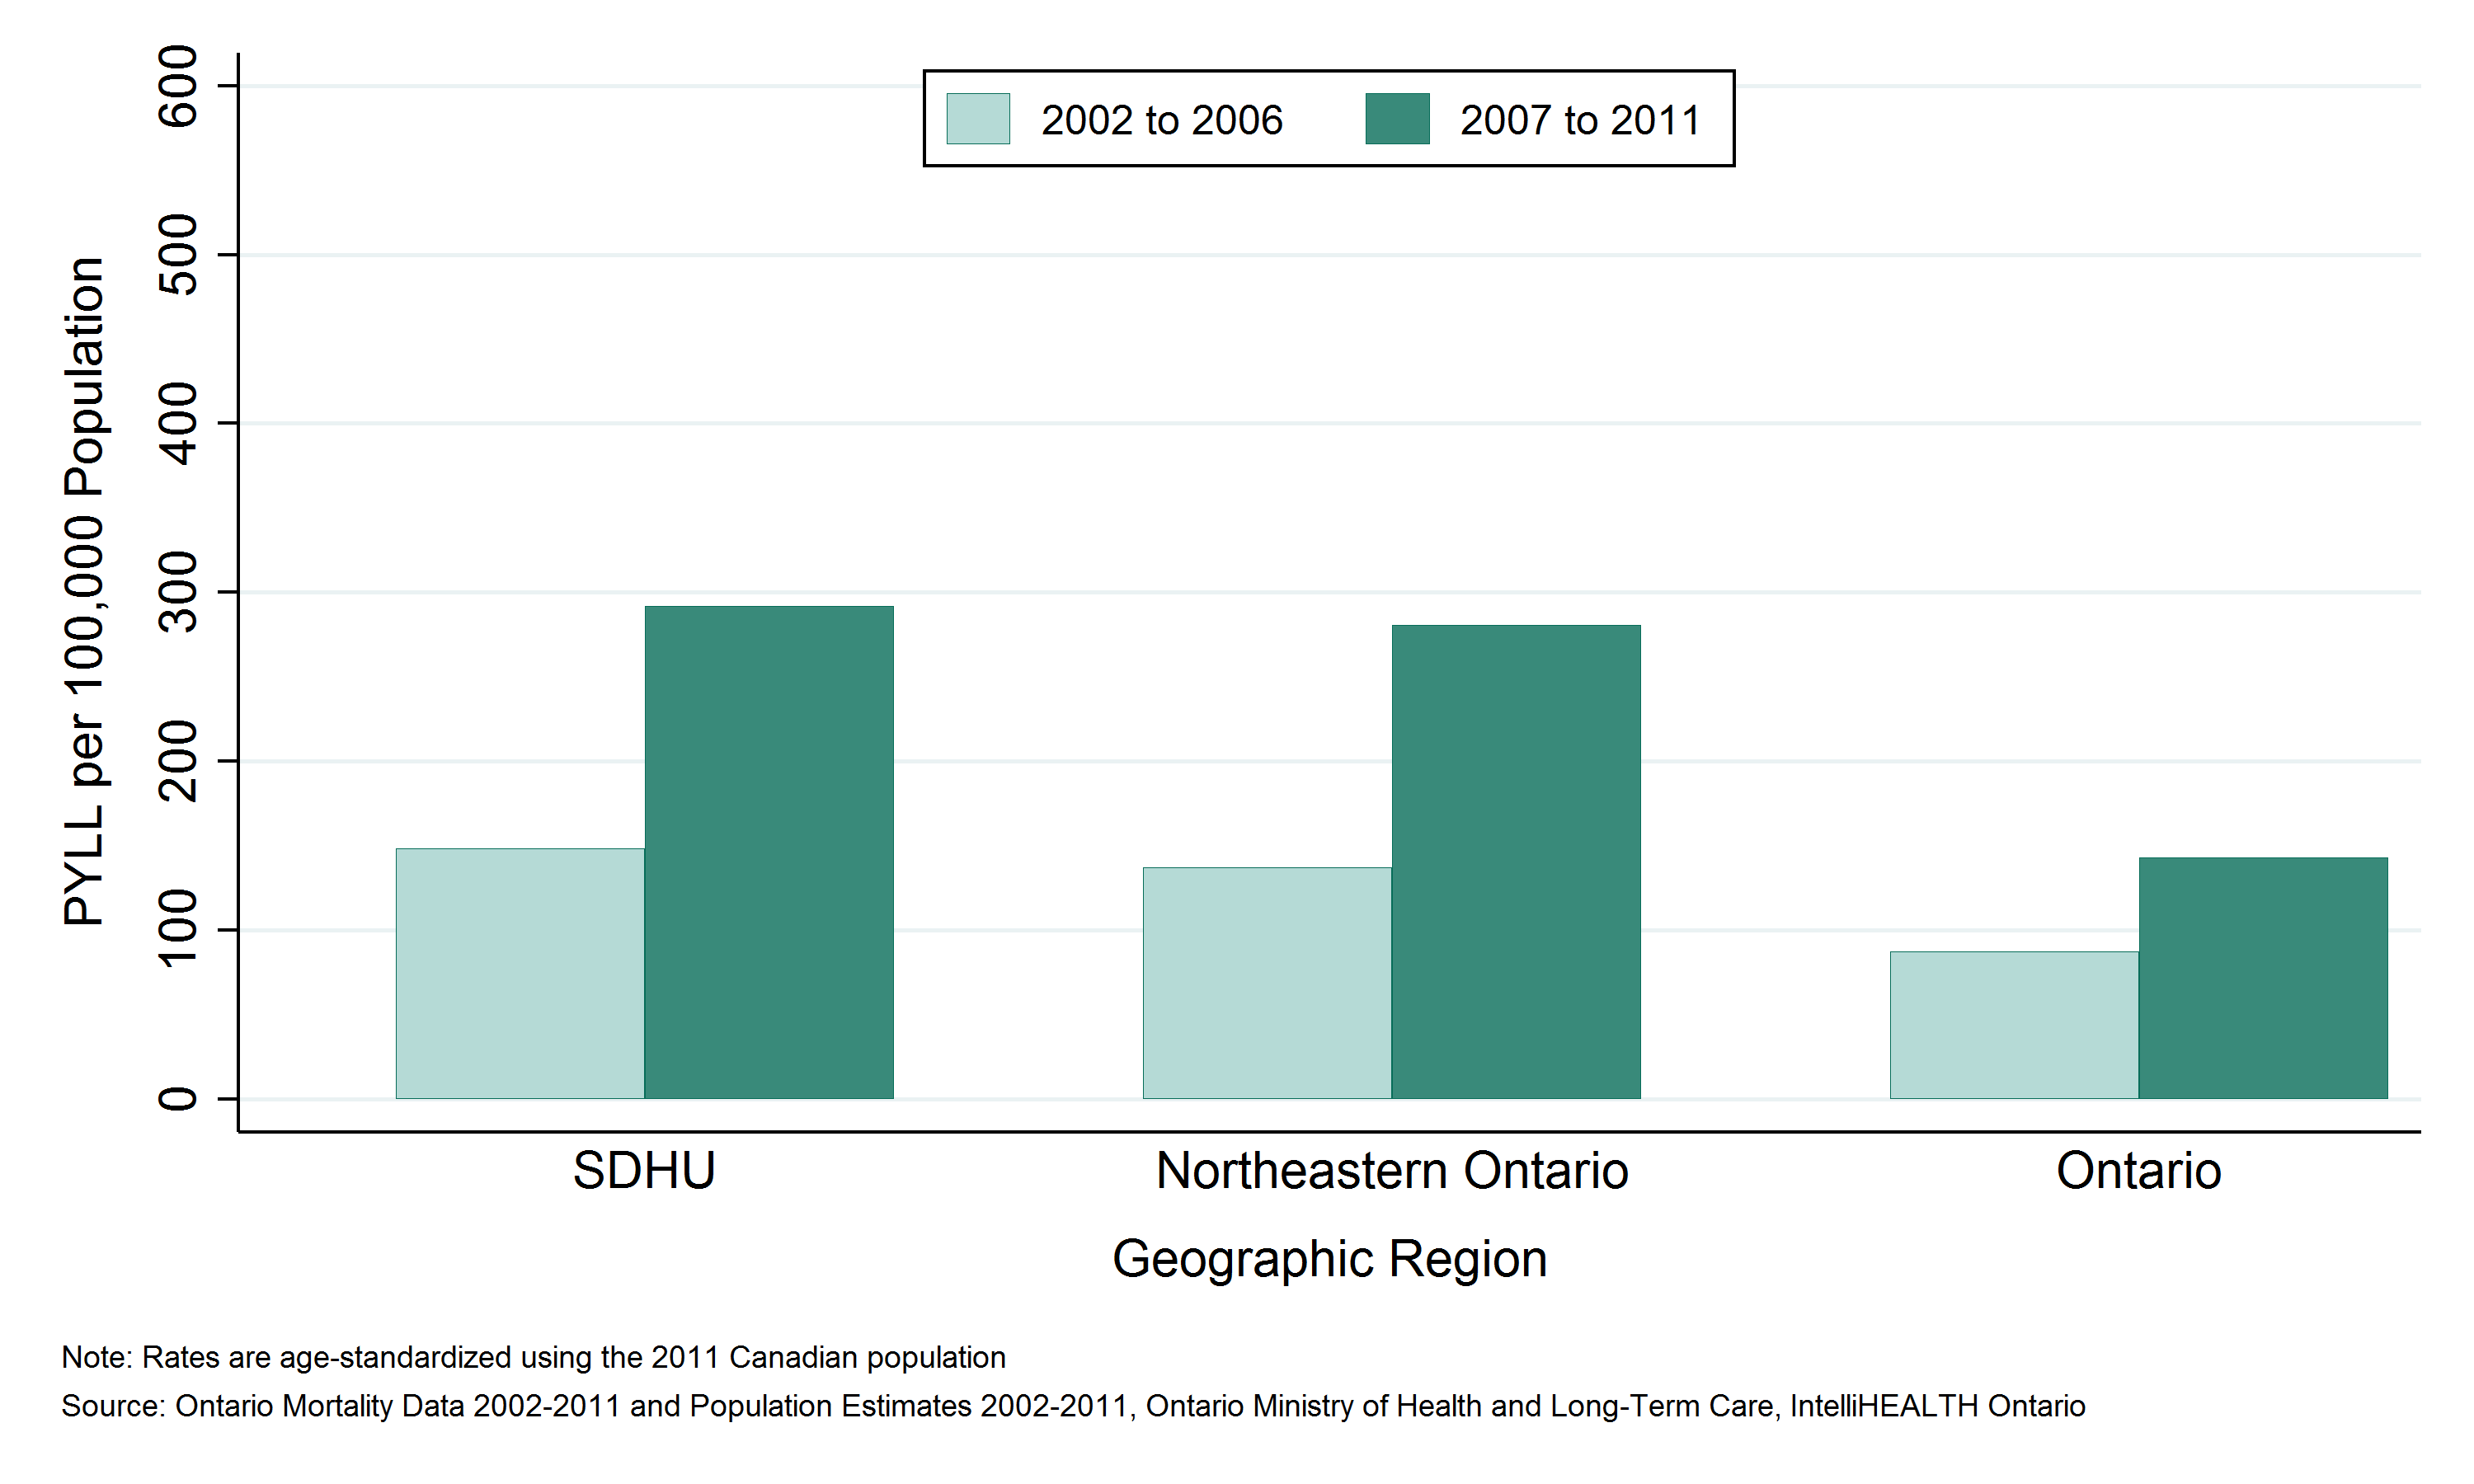
Potential years of life lost (PYLL) due to unintentional poisonings by geographic region
Key Findings:
- Between 2006 and 2015, Sudbury & District Health Unit (SDHU) area residents lost 2,776 years of potential life due to deaths from unintentional poisonings before the age of 75, an average of 555 per year.
- The rate of potential years of life lost (PYLL) in the SDHU area due to unintentional poisonings was 292 PYLL per 100,000 population per year.
- The rate of PYLL due to unintentional poisonings in the SDHU area has generally was similar to that in northeastern Ontario, while rates in both areas were higher than the rate in Ontario overall.
- Between 2002 to 2006 and 2007 to 2011, the rate of PYLL due to unintentional poisonings in the SDHU area increased.
Notes:
- Rates are age-standardized using the 2011 Canadian population.
- Data Source: Ontario Mortality Data 2002 to 2011 (extracted June 6, 2016) and Population Estimates 2006 to 2015 (extracted October 7, 2016), Ontario Ministry of Health and Long-Term Care, IntelliHEALTH Ontario.
Figure: Annual age-standardized rate potential years of life lost (PYLL), unintentional poisonings, by geographic region, 2002 to 2006 and 2007 to 2011
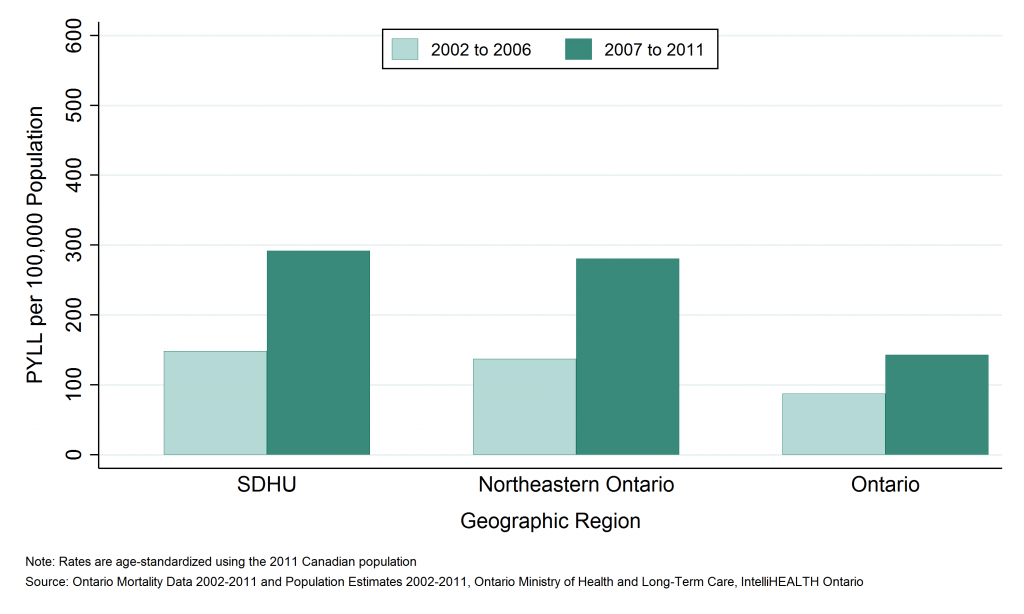
Table: Annual age-standardized rate potential years of life lost (PYLL), unintentional poisonings, by geographic region, 2002 to 2006 and 2007 to 2011
| Geographic Region | Rate per 100,000, 2002 to 2006 | Rate per 100,000, 2007 to 2011 |
| SDHU | 148.5 | 291.9 |
| Northeast | 137.0 | 280.5 |
| Ontario | 87.3 | 142.9 |
Table: Annual number of potential years of life lost (PYLL), unintentional poisonings, by geographic region, 2002 to 2006 and 2007 to 2011
| Geographic Region | Total PYLL, 2002 to 2006 | Total PYLL, 2007 to 2011 | Average Annual Counts, 2002 to 2006 | Average Annual Counts, 2007 to 2011 |
| SDHU | 1,447 | 2,776 | 289.4 | 555.2 |
| Northeast | 3,733 | 7,417 | 746.6 | 1,483.4 |
| Ontario | 54,748 | 91,732 | 10,949.6 | 18,346.4 |
This item was last modified on March 17, 2025